Olist Dashboard
The technical version of this write-up can be seen here!
Introduction
Olist is an E-commerce marketplace company that provides an online interface for customers to buy products from sellers. It is also a logistics company that handles deliveries of its products to its customers. An interesting combination where the logistics side of the company could undermine the growth of the E-commerce side by messing up their deliveries.
In this project, we set up a scenario where we build a dashboard and data pipeline for the company’s internal use using its publicly published two years’ worth of data. The data consisted of around 98k unique orders and around 96k unique customers.
Dashboard and Insights
Overview Page
First and foremost, we would like to know how the company is doing. We defined 5 KPIs that track customers’ transactions, and delivery performance. These metrics are:
- Gross Merchandise Value (GMV), calculated by summing up price of products from orders.
- Orders, unique order count.
- Customers, unique customers who did transactions.
- Fulfillment rate, the rate at which placed orders are sucessfully delivered.
- Late delivery rate, the rate of late deliveries among delivered orders.
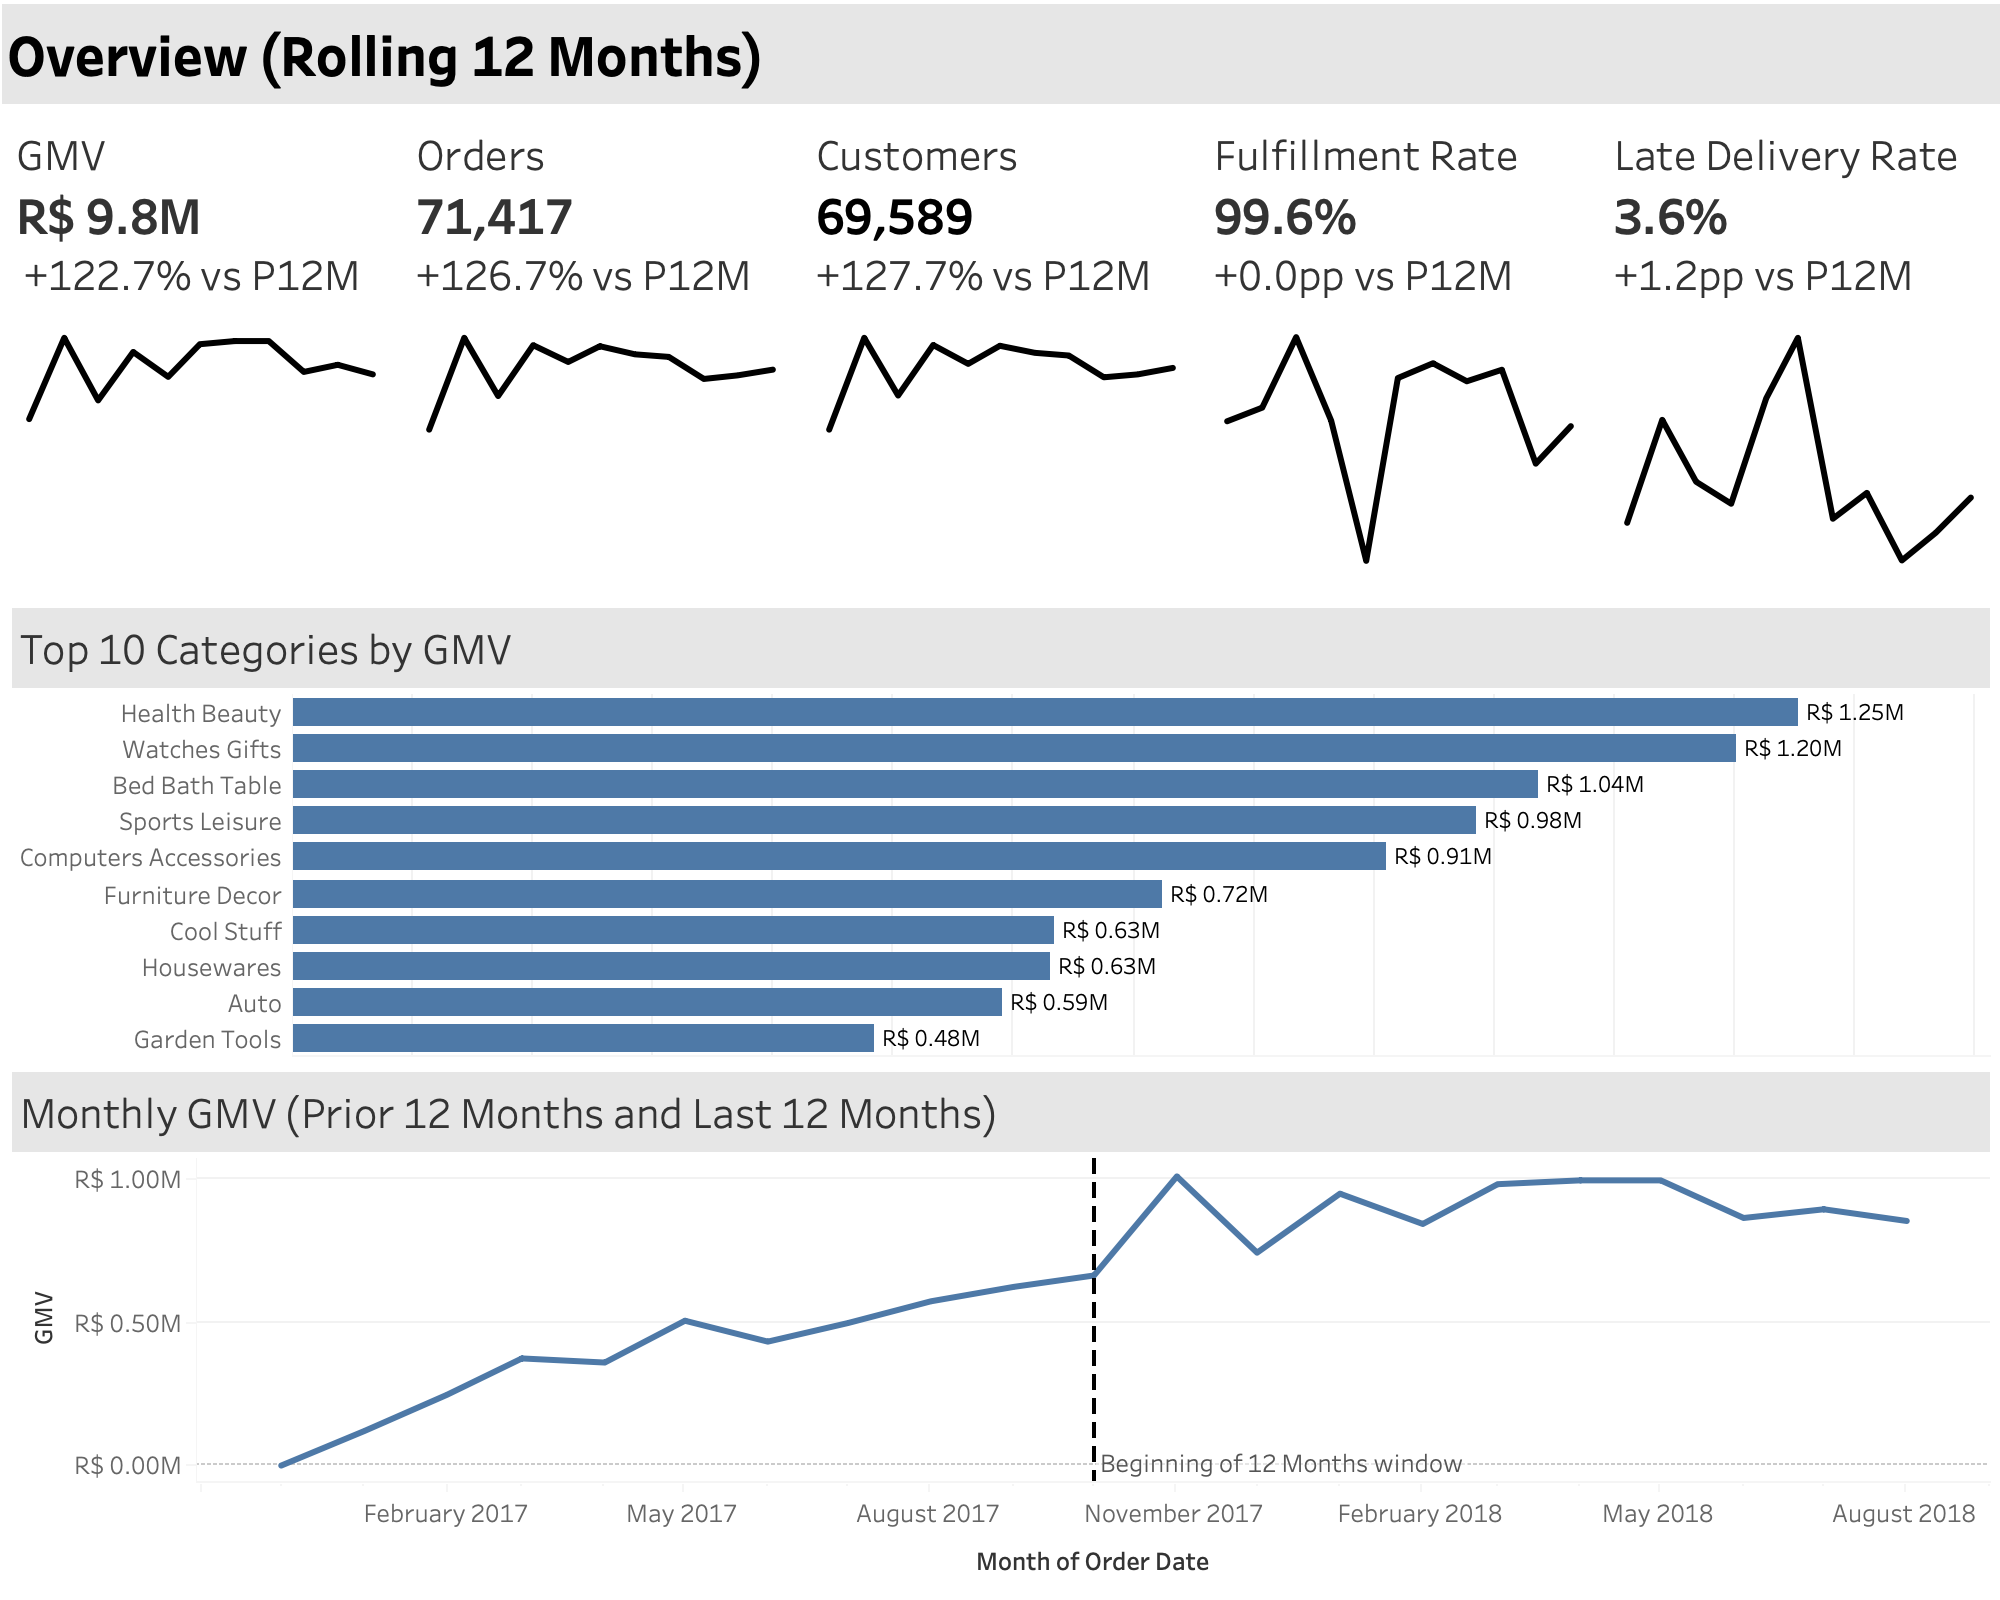
We want to compare these metrics performance to last year, so we made a rolling 12 months dashboard page for these 5 metrics. We added sparklines to quickly visualize trends, and percentage change compared to last year. Furthermore, we added top 10 categories by GMV to see which categories provided the biggest sales volume and we added a lineplot for GMV in the last 24 months to clearly see growth.
Explore the interactive dashboard on Tableau Public*
When looking at this page, we can see that KPIs that tracks volume seems to be doing really well compared to prior 12 months. However, when looking at the sparklines, we see that it is stagnating. This dashboard cannot explain the reason why. It could be that the market is saturated, or maybe the company is reducing customer acquisition spend, or other reasons. Only people at the company would know the answer to this.
The most eye-catching part however is the late deliveries rate. The average in 12 months is 3.6%. However, if you opened the dashboard and hover at the peak of the sparkline, it will state that it had 19% late delivery rate. This is very high and should warrant further investigation for the company.
Finally, the 24 months of GMV shows that the growth started to plateau in early 2018. Again, it might suggest a problem, or simply a consequence of business decision.
Deliveries Page
Moving on to deliveries, do recall that Olist is also a logistics company. It is quite important for customers to receive their product in time and provide them with the best experience.
Explore the interactive dashboard on Tableau Public*
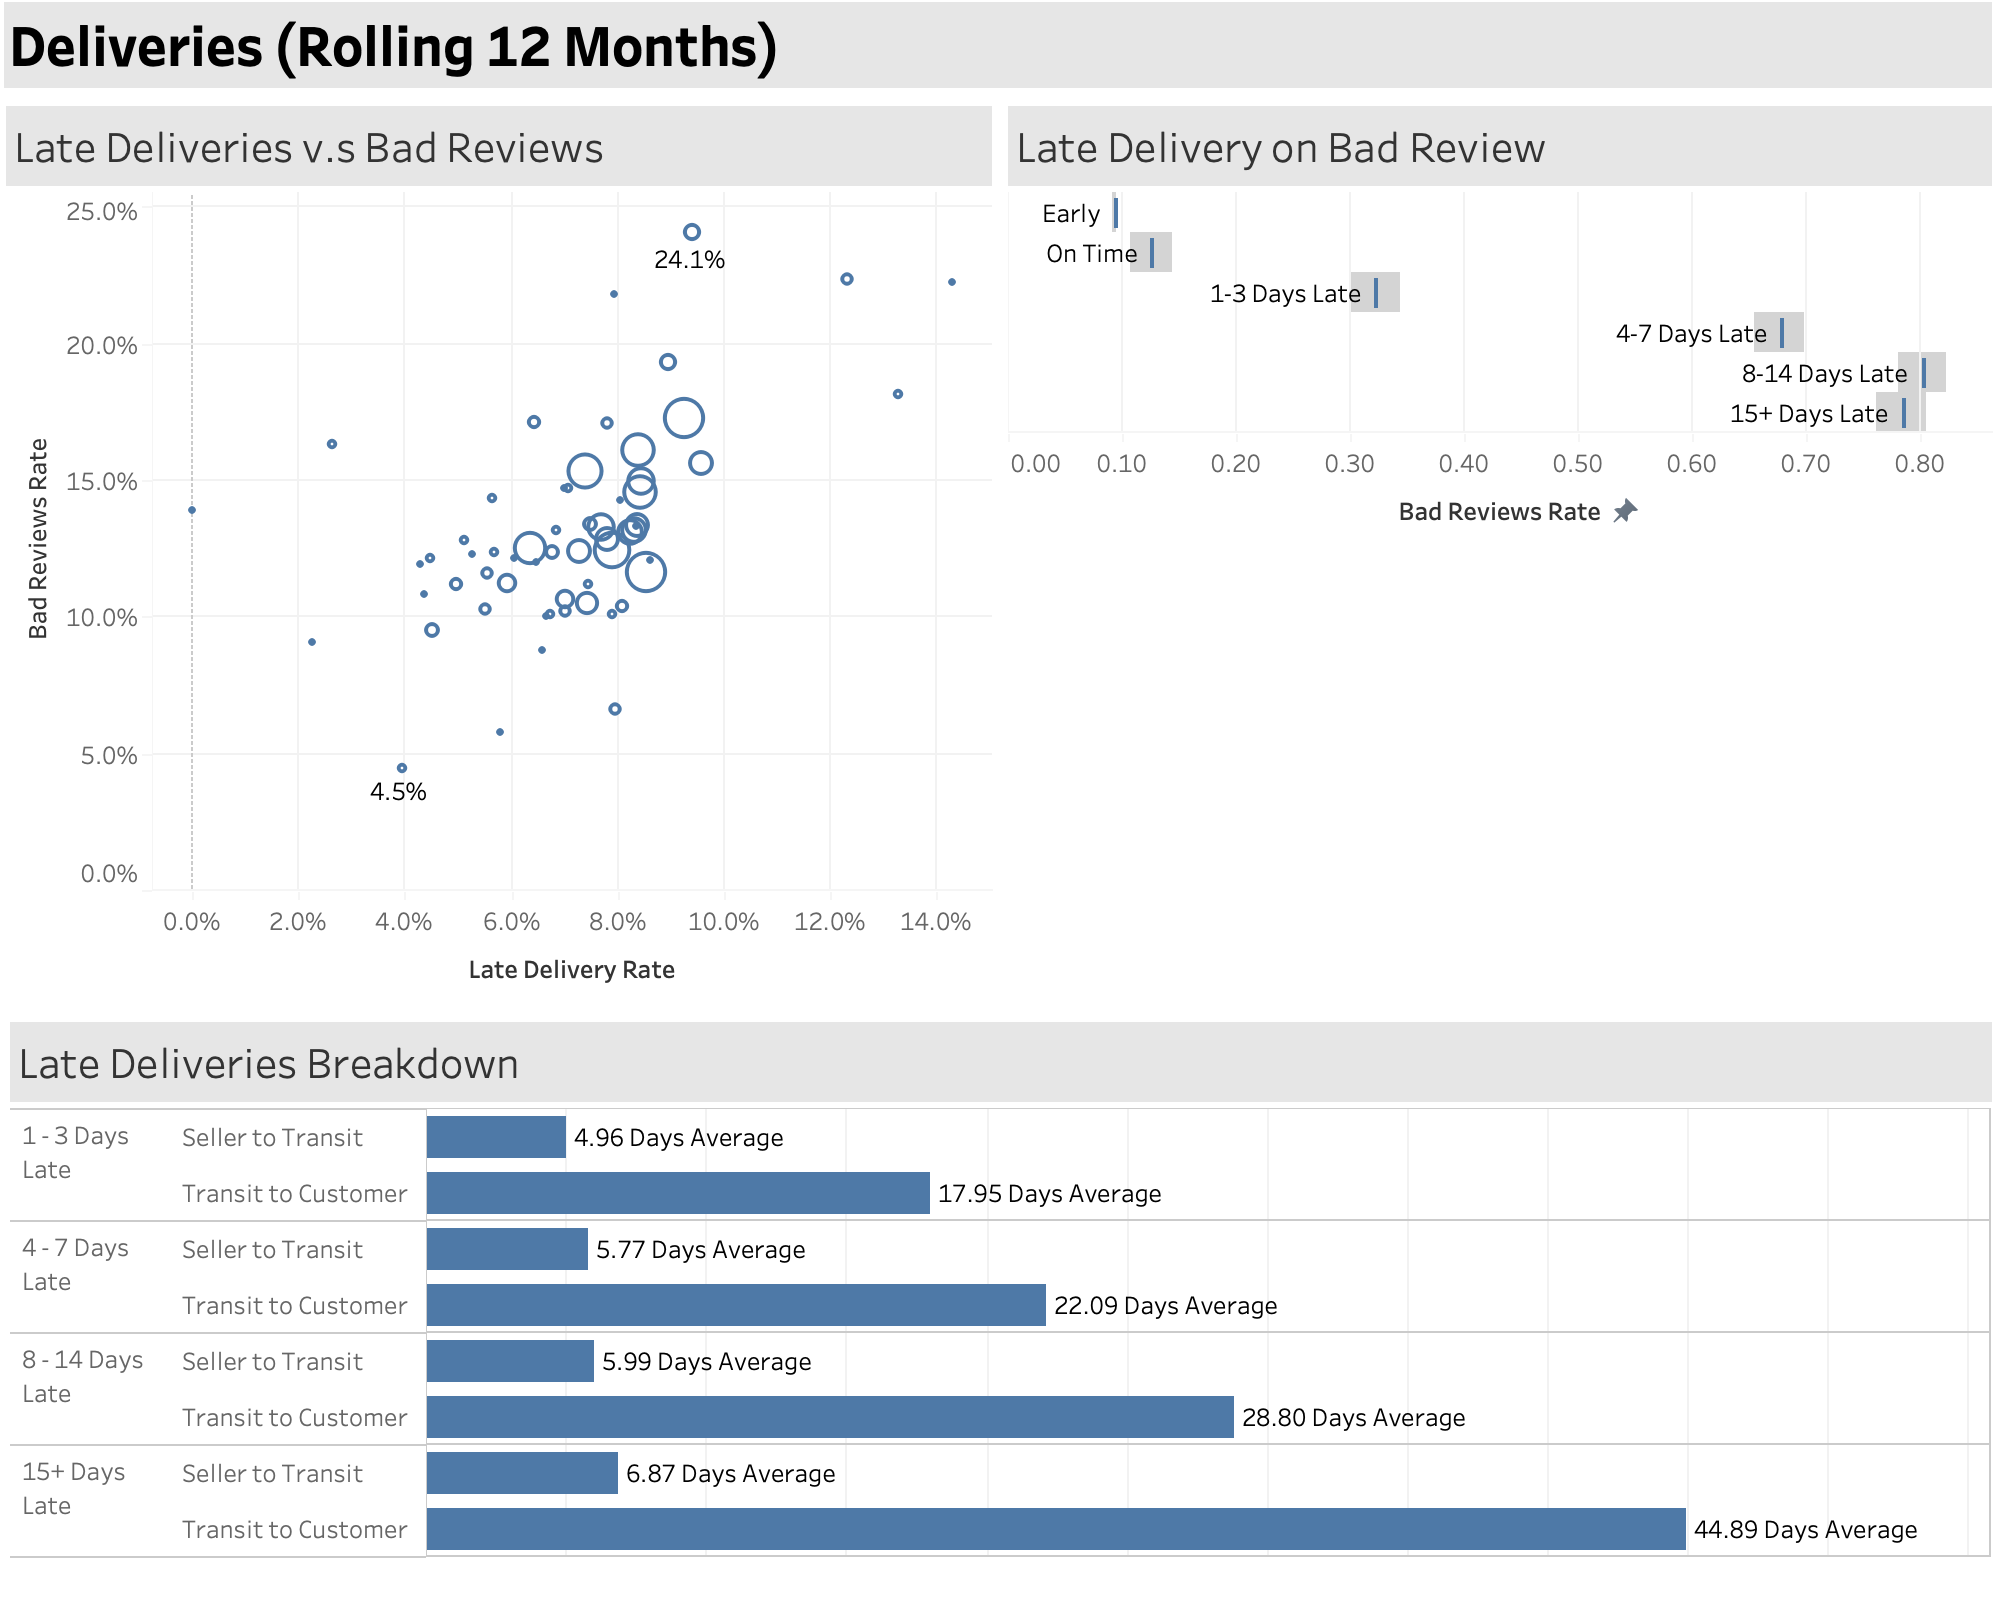
In order to visualize how the logistics side doing, we provided a scatter plot where we plot late deliveries (deliveries that exceeded their given estimation) against bad reviews (Review score that are less than or equal to two stars). We can see some positive correlation from this plot and the insight from this plot should be quantified by the next plot.
We grouped late deliveries by their severity and calculated the confidence interval (range of probable values given the data) for bad reviews rate. We can clearly see that early deliveries sits below 10% and on-time deliveries at around 12%. Moving on to late deliveries group however, we can see it jumps to around 32% for 1-3 days late and 68% for 4-7 days late then the increase flattens after 8-14 days late (a slight decrease from 81% to 79%, essentialy level compared to previous jumps). This plot does agree with the scatter plot suggesting that late deliveries are associated with bad reviews.
Lastly, we want to know the problematic spot in the deliveries. The delivery stages are provided and we plot them as Seller to Transit and Carrier to Customers. It clearly shows that Seller to Transit seems to be pretty consistent across late deliveries group compared to Carrier to Customers, where it carries most of the workload and grows the most as deliveries get later.
What didn’t go through
Initially, there were two more topics that were planned to be covered. The first is customer retention. However, after initial exploration, we found out that only around 3% of the customers have repeat orders. This number is very low and it doesn’t really make sense to commit a whole page at this point.
Another topic is reviews by categories. We found out that reviews are tied to orders and not products. A small portion of order-category level data (2.4% of them) is affected. Meaning that orders that have multiple categories of products are assigned reviews that we can’t assign to which categories. While it is only a small portion of the data, we decided to drop the idea since we didn’t want to arbitrarily solve this problem and kept categories performance on overview page.
Conclusion
To sum things up, Olist, an E-commerce marketplace and logistics company, has a stagnating growth due to unknown reasons, and they had late deliveries problem which is associated with bad reviews. It is important to note that if late deliveries were the reason for bad reviews (can be further checked through reviews description), it means that sellers are receiving bad reviews in place of the logistics.
Therefore, we advise that they should confirm or investigate the reason of their plateauing in volume growth. It is most important that the company investigate and find solutions to remedy late deliveries as it is possible that it affects sellers in their marketplace as well.
For a more thorough walkthrough of this project do check