| Name | Description |
|---|---|
| Date | Date of record |
| Mode | Mode of transportation |
| Total_passengers | Total passengers for the date. |
Jakarta Public Transportation Daily Total Passengers Analysis and Modelling
r
time series
regression
An analysis of daily total passengers for Jakarta public transportation and forecasting methods were developed and tested in this 28-months dataset for three modes of transport.
Introduction
This project analyzes daily total passengers for multiple modes of public transportation in Jakarta. Forecasting methods will also be developed where the complexities of these methods are limited to what I have covered during my graduate coursework.
The main goal of this analysis project is to identify periodical patterns, and events that affect the total passengers. Then, using that knowledge to develop a model in order to forecast daily passengers through a normal week and event.
A more technical walk through of this project can be seen in here
About the Dataset
The dataset is taken from Satu Data Jakarta which is a open data portal by the Jakarta provincial government. During the time of analysis, the latest data entry is at 2026-04-30. This dataset provides daily passengers data for 12 modes of transportation. However, at a glance, there are only 8 modes of transportation.
The structure of the data after cleaning is shown in Table 1.
The 8 mode of transport and its daily total passengers can be seen in Figure 1. The earliest entry in this dataset is at 2024-01-01. While Satu Data provided other dataset that goes earlier than this, those datasets have different formats and possibly different recording methods, hence it is decided that we should stick with this one dataset.
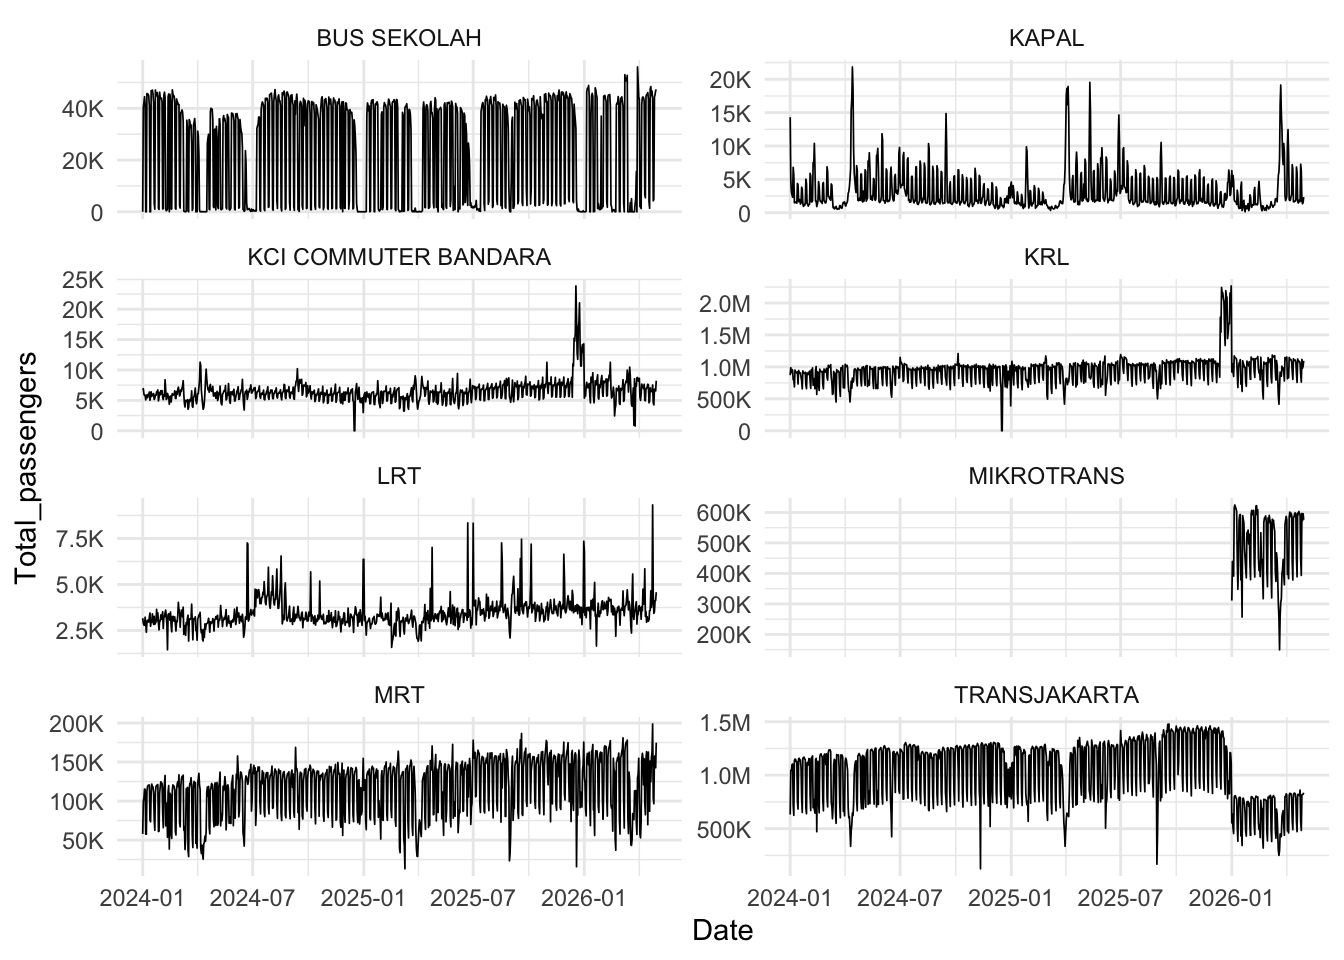
It is clear that MIKROTRANS was only properly defined starting from 2026-01-01. The total passengers from MIKROTRANS hovers around 500K, and coincidentally, TRANSJAKARTA starting from 2026-01-01 drops by around 500k. We think that it is safe to assume MIKROTRANS was initially defined as part of TRANSJAKARTA and because there is not a lot of data right now, we will merge it back.
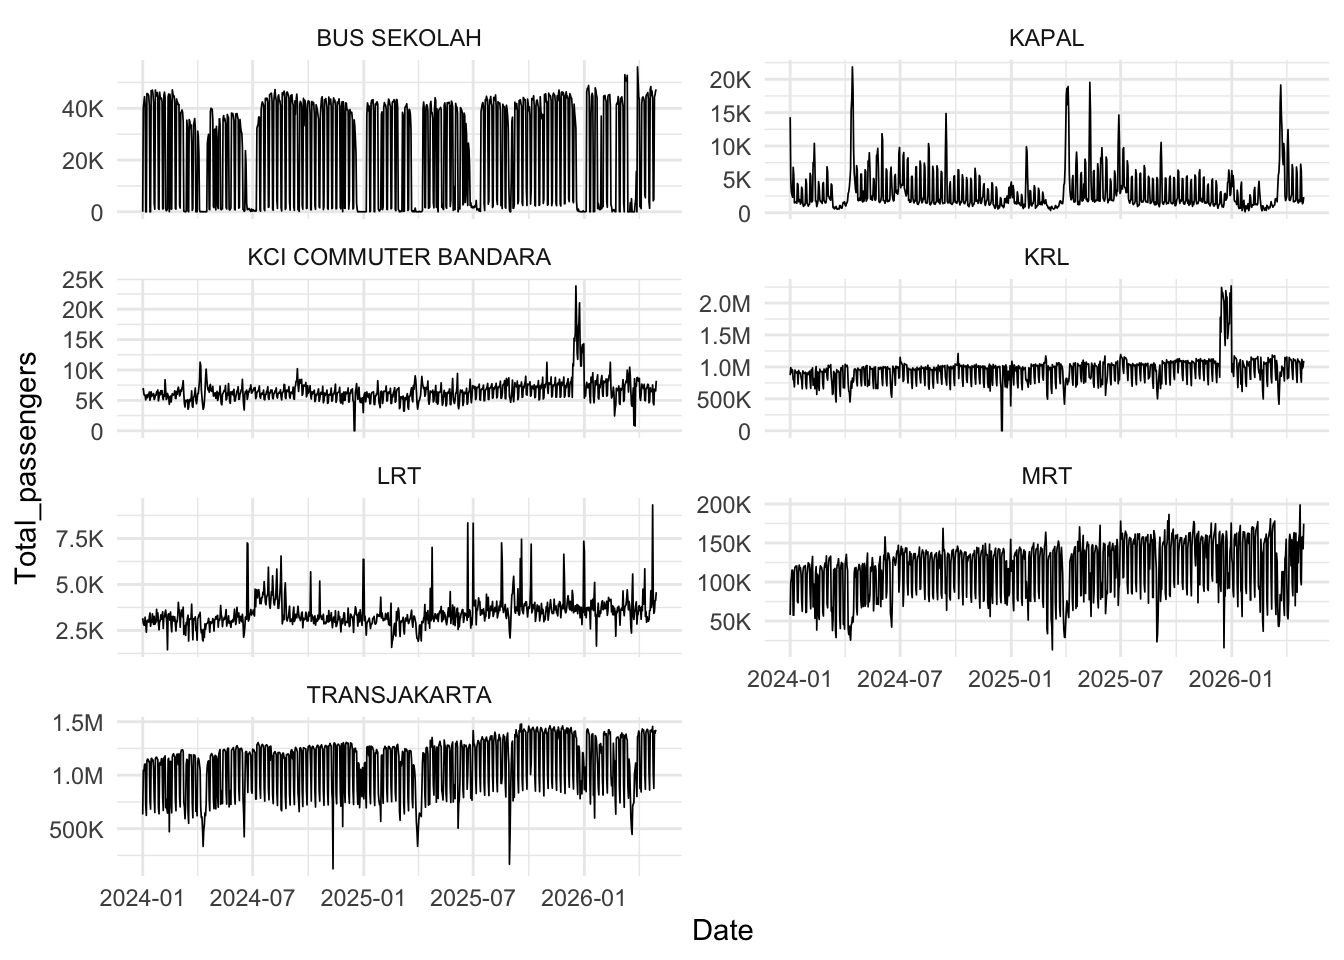
MIKROTRANS and TRANSJAKARTA merge.
Looking at the daily total passengers, there are 3 likely mode of transport that we can model. KRL, MRT, and TRANSJAKARTA shows pretty consistent seasonality with some outliers. KCI COMMUTER BANDARA is another candidate, but the total passengers is not high. BUS SEKOLAH should have a nice seasonality, but it can be seen in Figure 2 that the values often dip into 0, it might indicate that BUS SEKOLAH is not operational in the weekends and those dips would ruin the model. LRT have the lowest total passengers relatively, and with that amount, it is also quite noisy so we will not be modeling that. Lastly, KAPAL total passengers looked erratic and might depend on unpredictable variable such as weather.
From Figure 2, we can see some abnormal total passengers. Specifically, for KRL and KCI COMMUTER BANDARA at December 2025, there is a massive surge of total passengers. This warrants further checks before we move on to analysis and modelling.
Missing Values and Imputations
During data checks, we discovered that KRL, KCI COMMUTER BANDARA, and BUS SEKOLAH contains 0 in their records of daily total passengers. For BUS SEKOLAH it is understandable considering they are not operational during weekends, however, the same cannot be said for trains. Both trains have 0 record in the same two days as shown in Table 2, suggesting a systemic error. We will be imputing these values as we do not have a reliable prior for these two days.
KCI COMMUTER BANDARA and KRL.
| Date | Mode | Total_passengers |
|---|---|---|
| 2024-12-16 | KCI COMMUTER BANDARA | 0 |
| 2024-12-17 | KCI COMMUTER BANDARA | 0 |
| 2024-12-16 | KRL | 0 |
| 2024-12-17 | KRL | 0 |
We decided to check weekly average to see some unnatural surge or decline in total passengers. This allow us to identify possible events that might be useful during analysis and modelling.
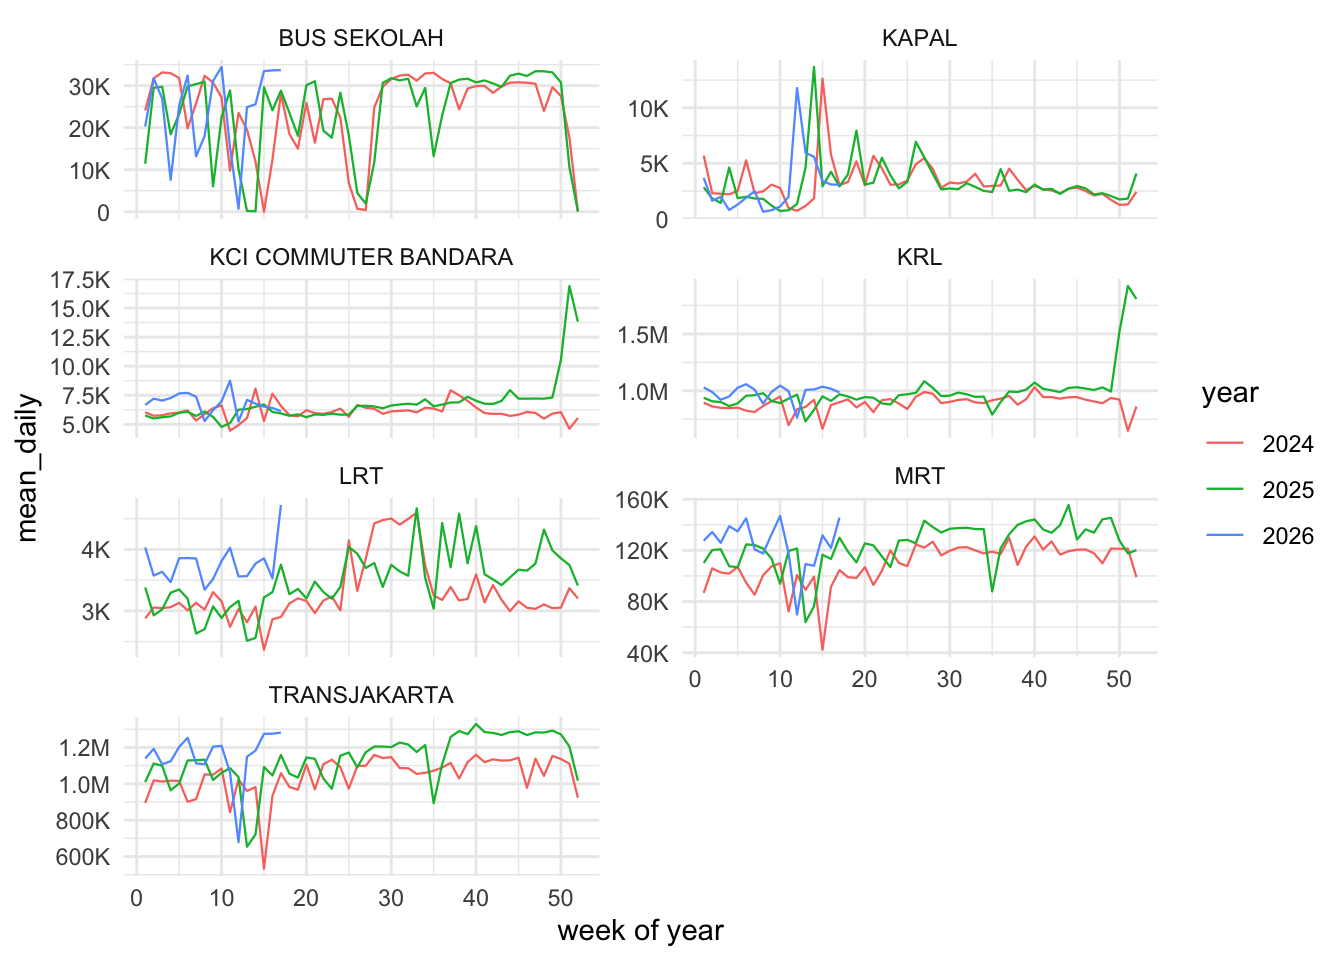
At around week 15, there are dips across all mode of transport except for KAPAL and KCI COMMUTER BANDARA. Week 15 happened to coincide with Eid which is around April 2024.
We can see we have a dip at week 35 only for year 2025, suggesting that something happened during that time that disturbs TRANSJAKARTA, MRT, BUS SEKOLAH, and LRT.
As mentioned earlier, there is an anomaly at the end of the year for both trains as we can clearly see by the massive spike for year 2025. Interestingly, we see a dip for year 2024 for both trains, which is also not normal since it is new year’s and we should expect some kind of increase if not normal total passengers. These anomalies will be checked by cross-referencing the data that we get from Badan Pusat Statistik (BPS).
For other unidentified anomalies that we found and may see in the future, we will be referencing news articles.
KRL.
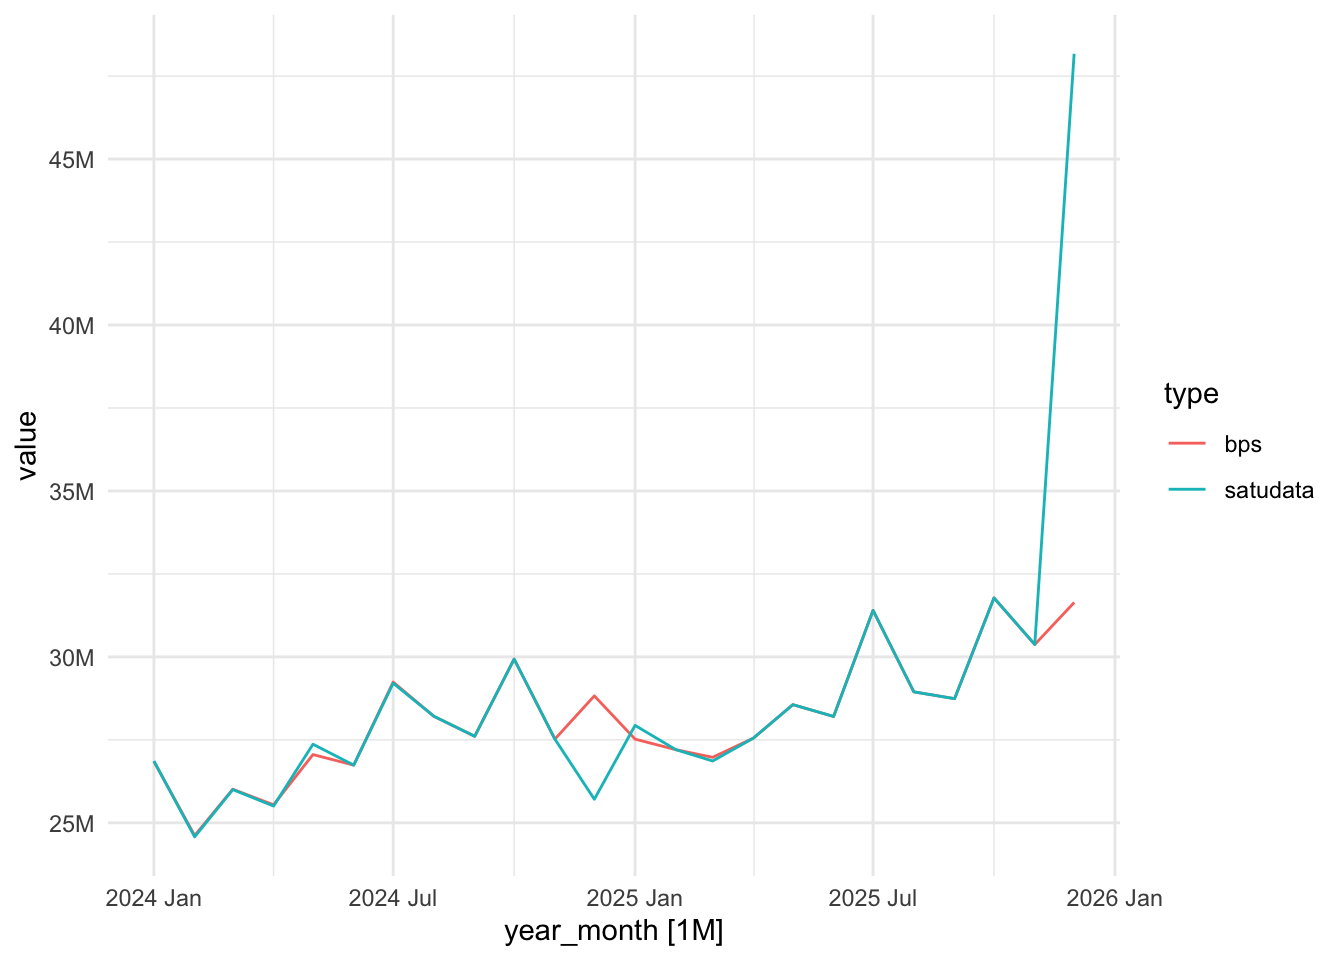
Figure 4 shows how data from Satu Data compares to data from BPS. Mostly, they overlaps but there are differences at three different points. Interestingly, both of these sources cited mostly the same data sources, so these discrepancies are not expected.
First, we know from earlier that we have data where the total passengers are 0 at 16th and 17th of December 2024. We will be imputing the two missing records since trying to match the BPS data by distributing over the two records will introduce unnecessary bias.
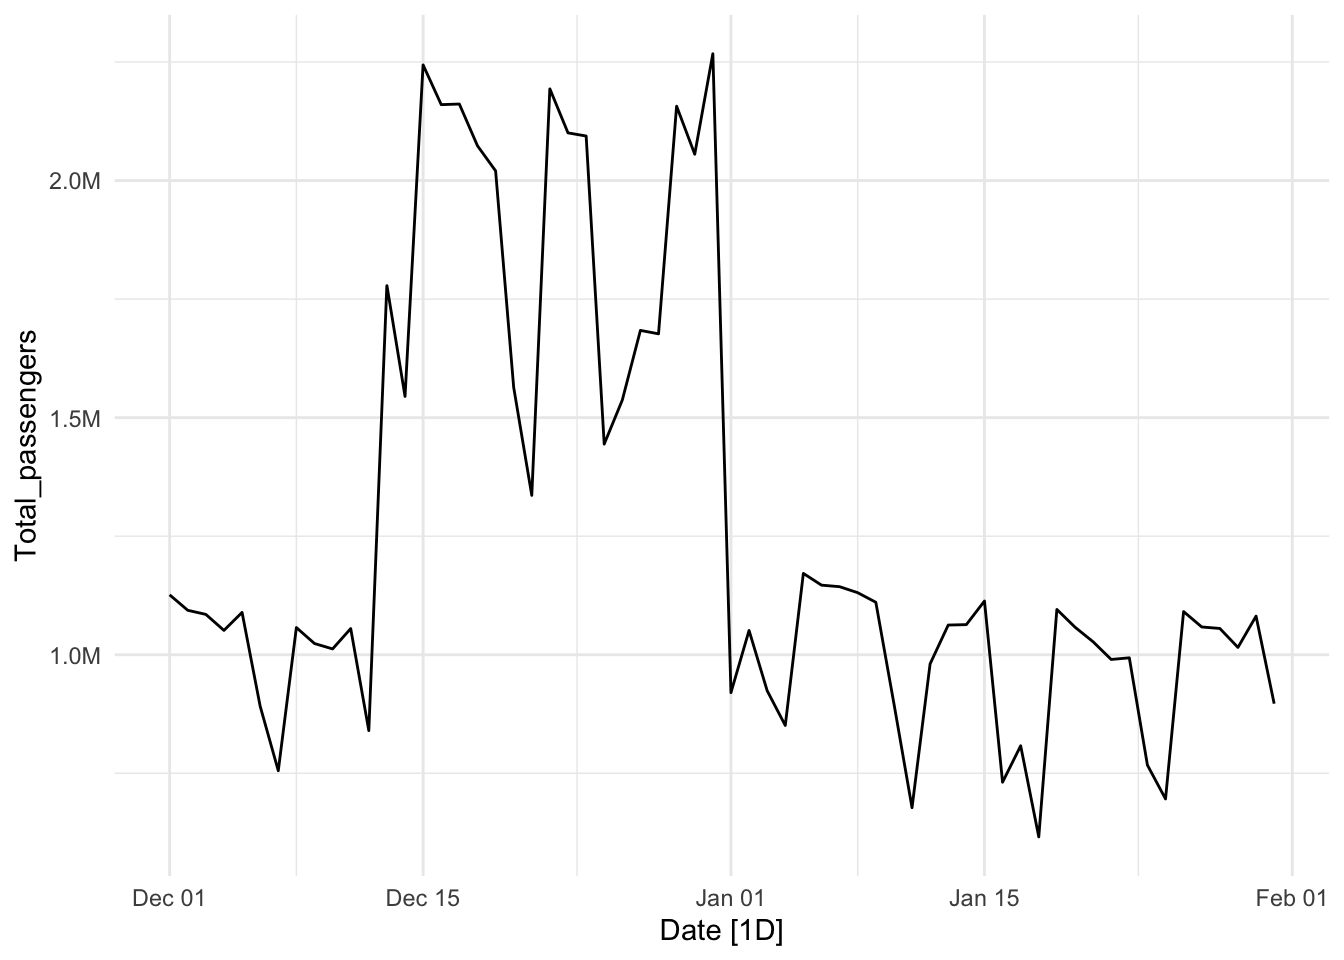
Next, we have a sharp spike during December 2025, where we identified the source of that spike is the record from 13 December 2025 until 31 December 2025 as shown by Figure 5. Intuitively, it is absurd to expect a double amount of passengers, even during Nataru (Natal Tahun Baru). However, just to be safe, we checked news articles that did mention these.
From this Kompas article, total passengers from 18 - 25 December 2025 is 7.839.814. Also, total passengers in 25 December 2025 is 724.536.
Clearly, our data is way off. By referring to 25 December 2025 data, we decided that dividing the total passengers during that interval would be best. It would not provide a perfect match for BPS data, but, it is a big interval and we can’t impose too much assumption.
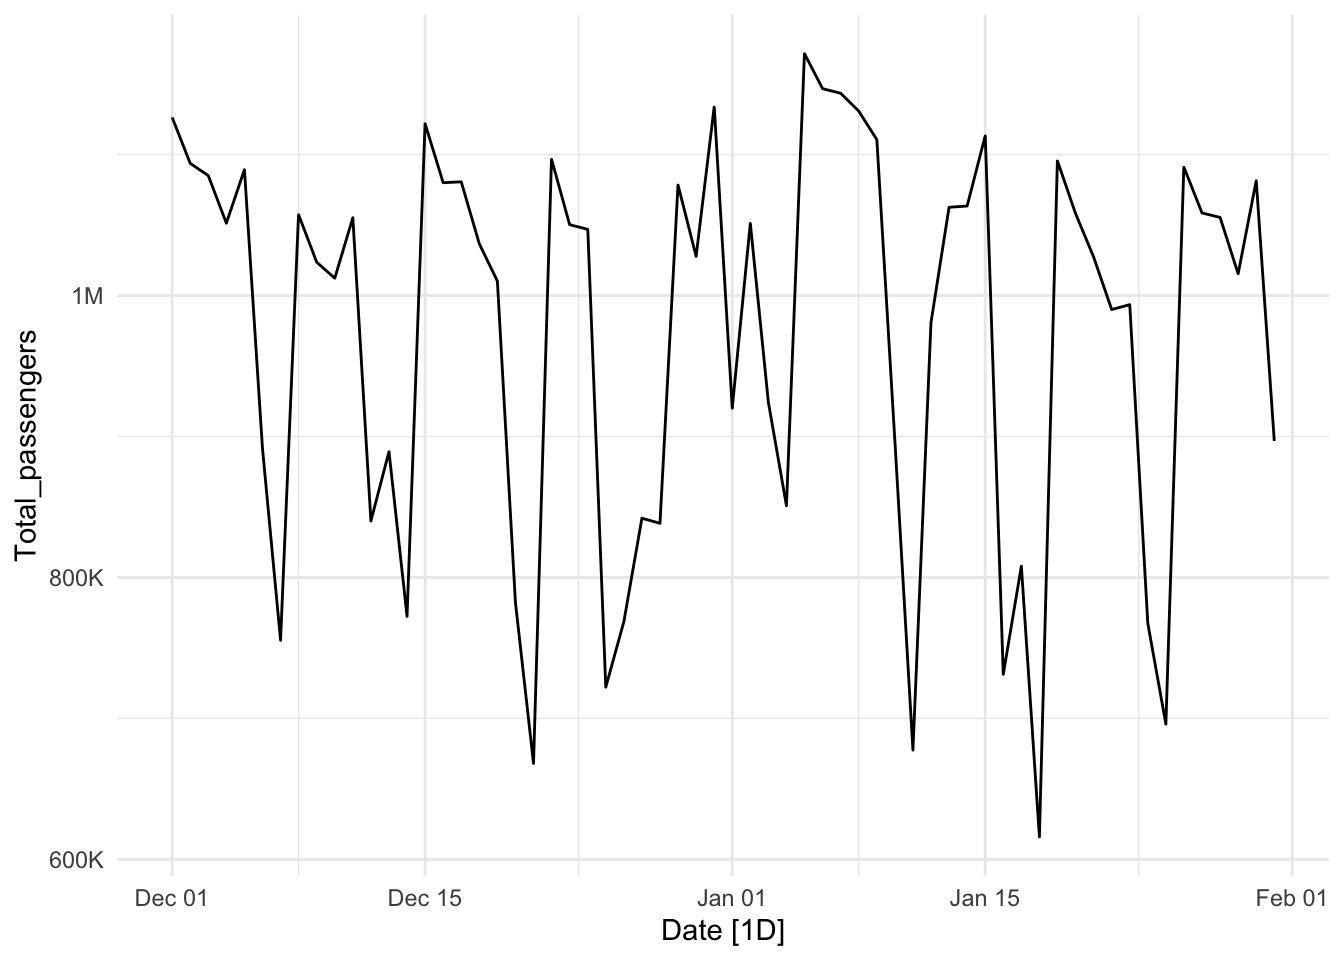
After dividing by 2, the data looks inline with the data outside the interval. However, we might lose the increase in total passengers that we might expect during Nataru holiday.
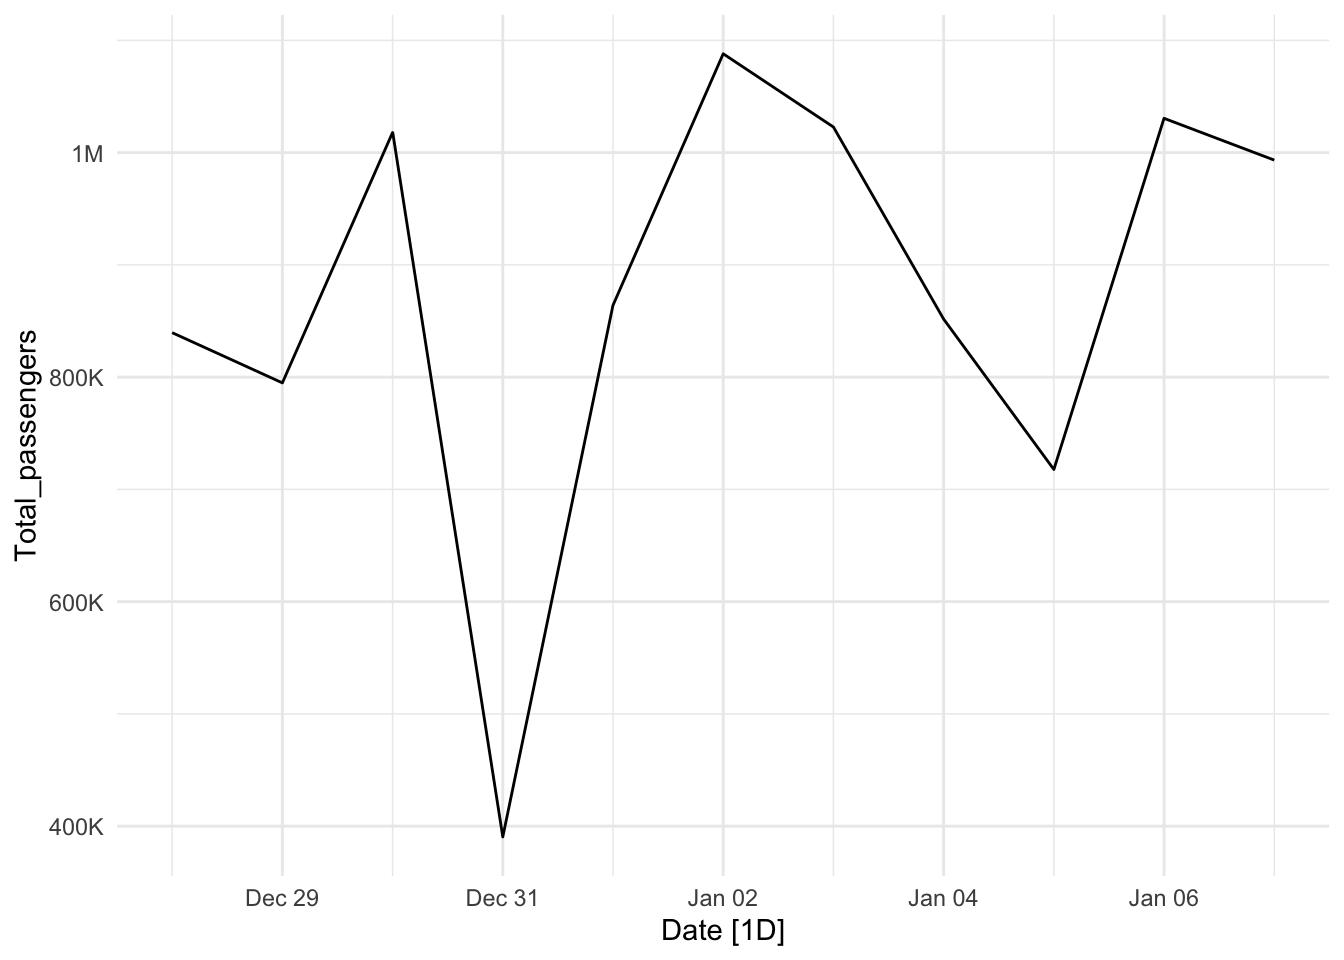
Now, we move on to 2024 data where we see a dip during the same interval. Figure 7 shows that it is quite unnatural, during the Nataru holiday at 31 December 2024, where trains operational hours are extended, the total passengers dipped by around half instead. We will be imputing this value since we don’t have a good reference at this time.
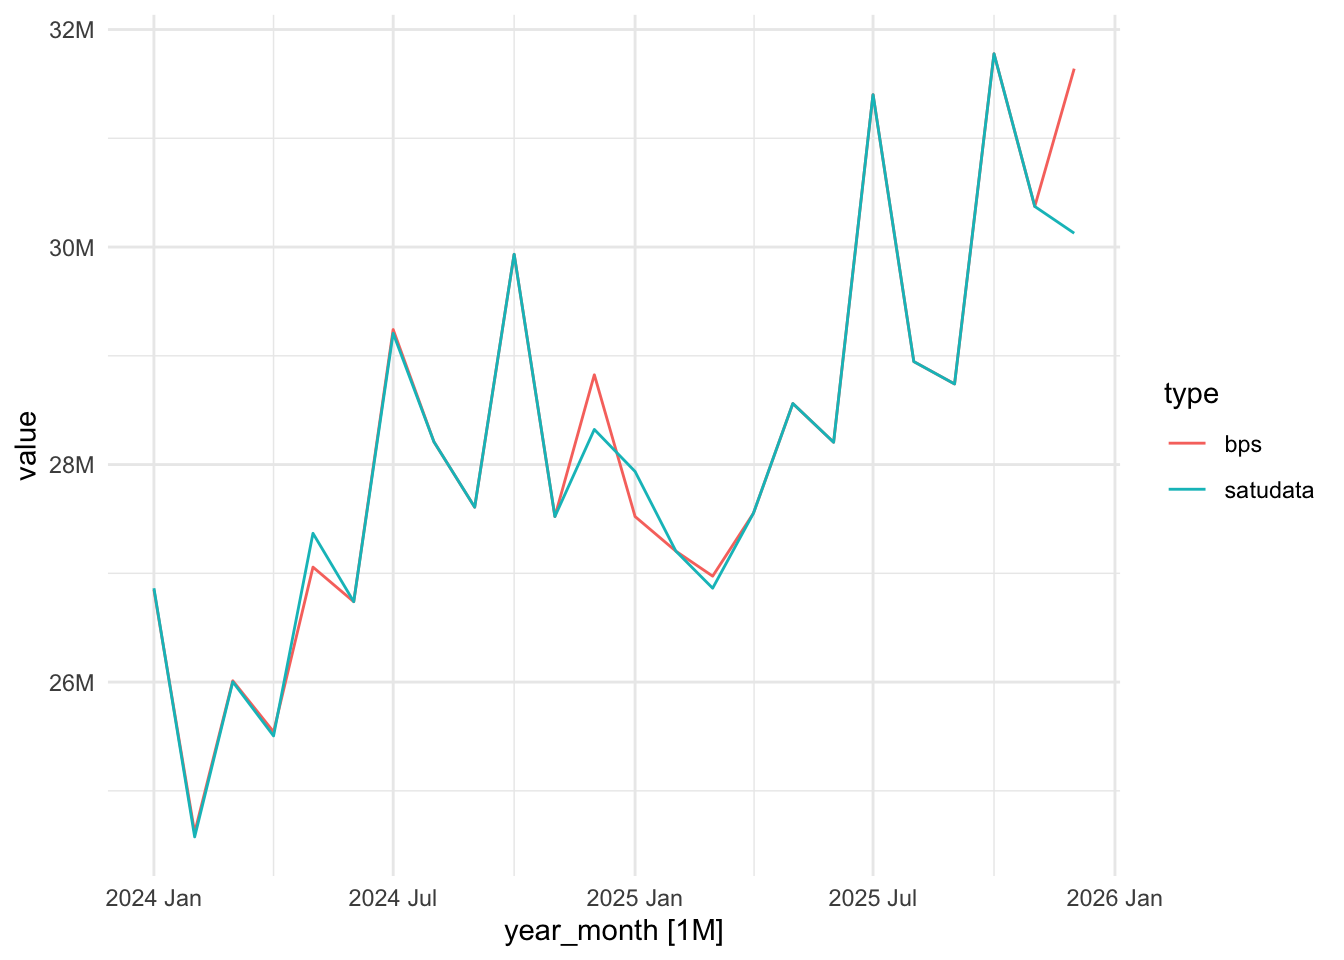
After all these imputations, we can see in Figure 8 that while we are closer to BPS data, it is still not a perfect overlap around the problematic time. However, given the information that we have, it is the best that we can do without introducing too much bias. One caveat however, all of these fixes, except for the dip in December 2024, are only applied to KRL since KCI COMMUTER BANDARA does not have a reference in BPS data.
Analysis
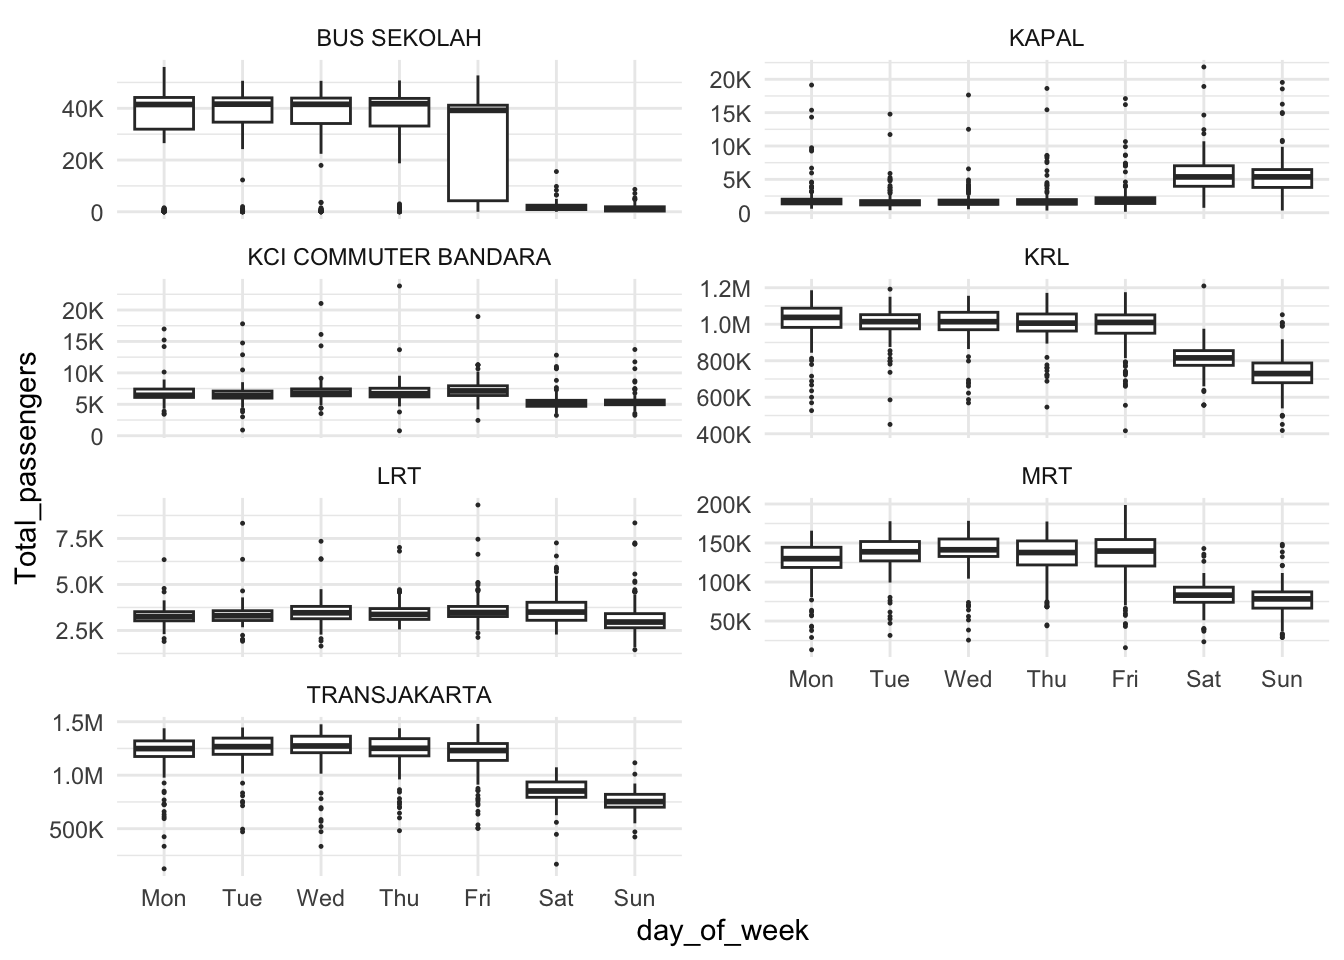
As we can expect from these modes of transport, there is weekly seasonality. Every mode of transport have a decrease during weekends, except for KAPAL that have an increase during weekends and LRT which barely showed any change. It is also obvious that BUS SEKOLAH is not operational during weekends, except for a couple of instances. KRL, MRT, and TRANSJAKARTA have outliers that lie on the lower end, meaning one-off events that caused these outliers, typically disturbs the operations of these modes of transport.
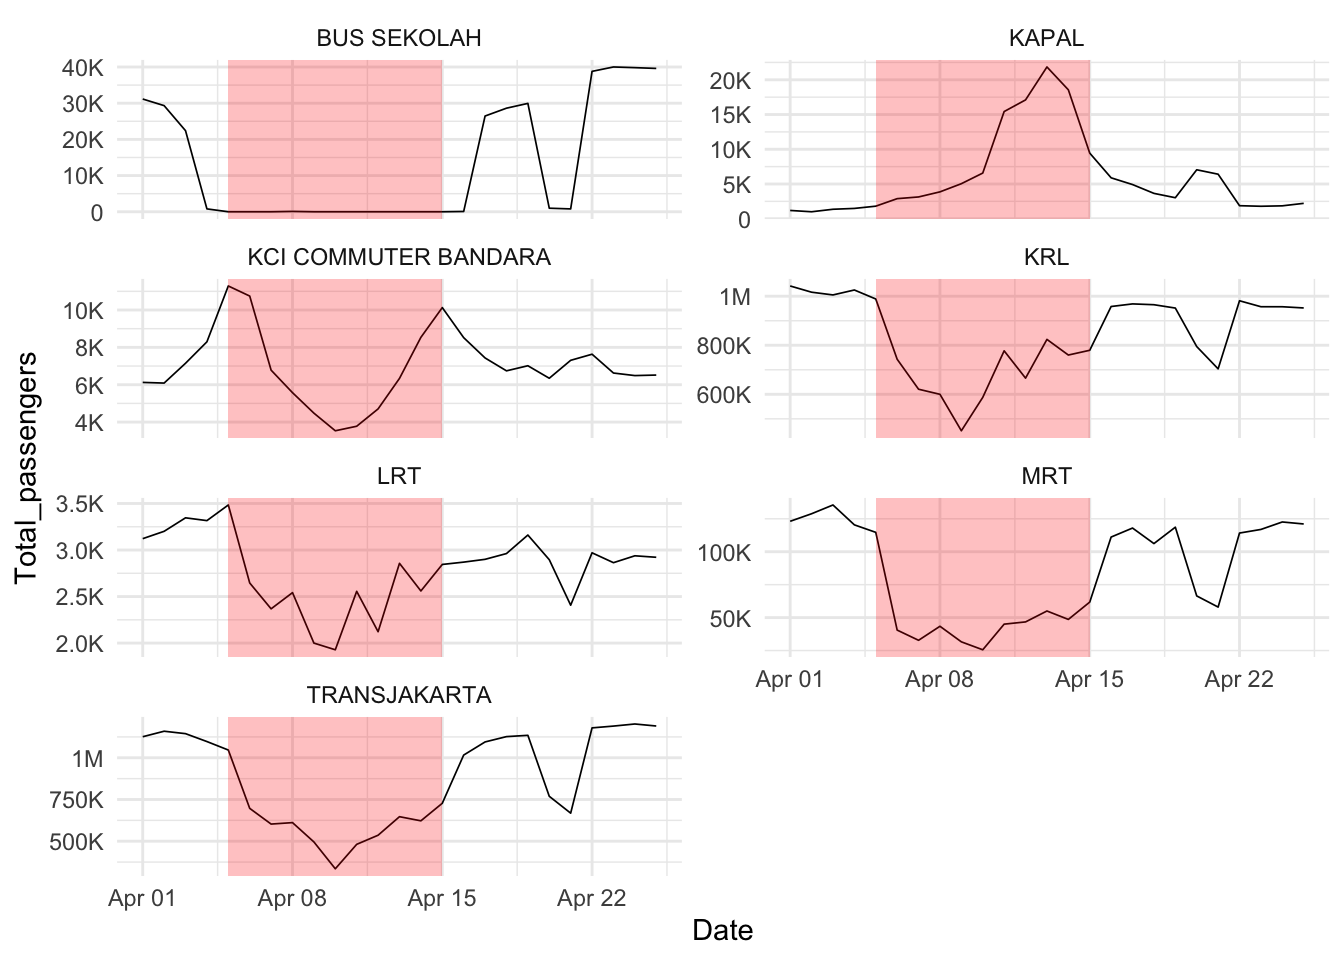
We can identify a recurring event that happened every year. Figure 10 shows an example of Eid during 2024. There is a visible dip during that period for every transport method except for KAPAL. Interestingly, KCI COMMUTER BANDARA have a dip as well, even though one would usually expect people to travel out of town or province during this time. Perhaps, the effect showed before and after Eid instead for KCI COMMUTER BANDARA.
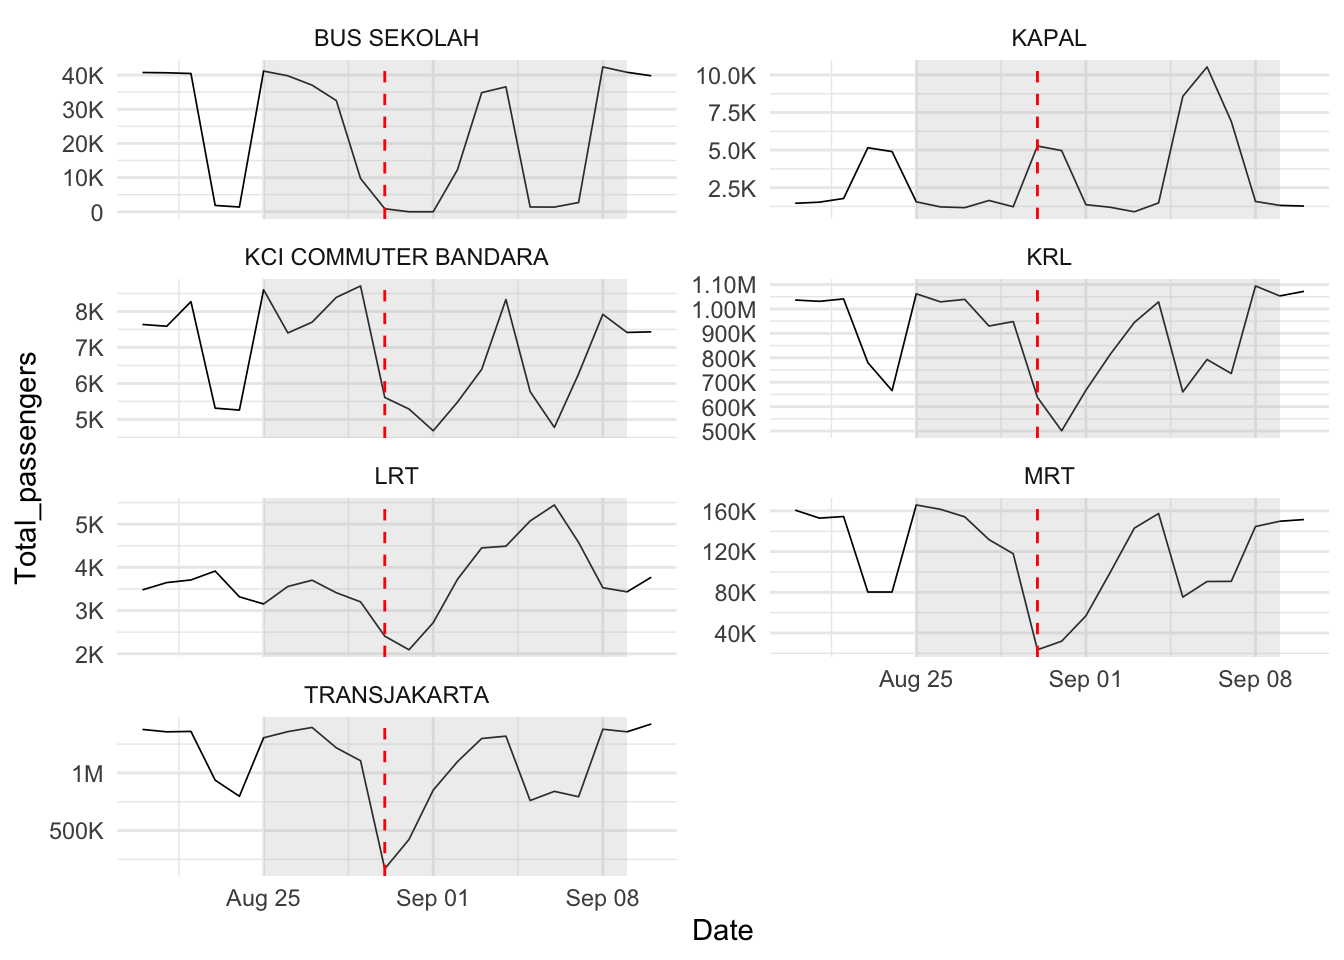
Another identified event is the riot that happened throughout 25 August 2025 until 9 September 2025. The period has been marked with grey rectangles in Figure 11. We can see some sharp dips within that period for KRL, MRT, TRANSJAKARTA, and BUS SEKOLAH.
Specifically, during 30 August 2025, marked by a dashed red line, there is a report that MRT, and TRANSJAKARTA stopped operating. We can also see that at 31 August 2025, KRL have a sharp dip. But, unfortunately, We could not find any reports that explain this specific dip.
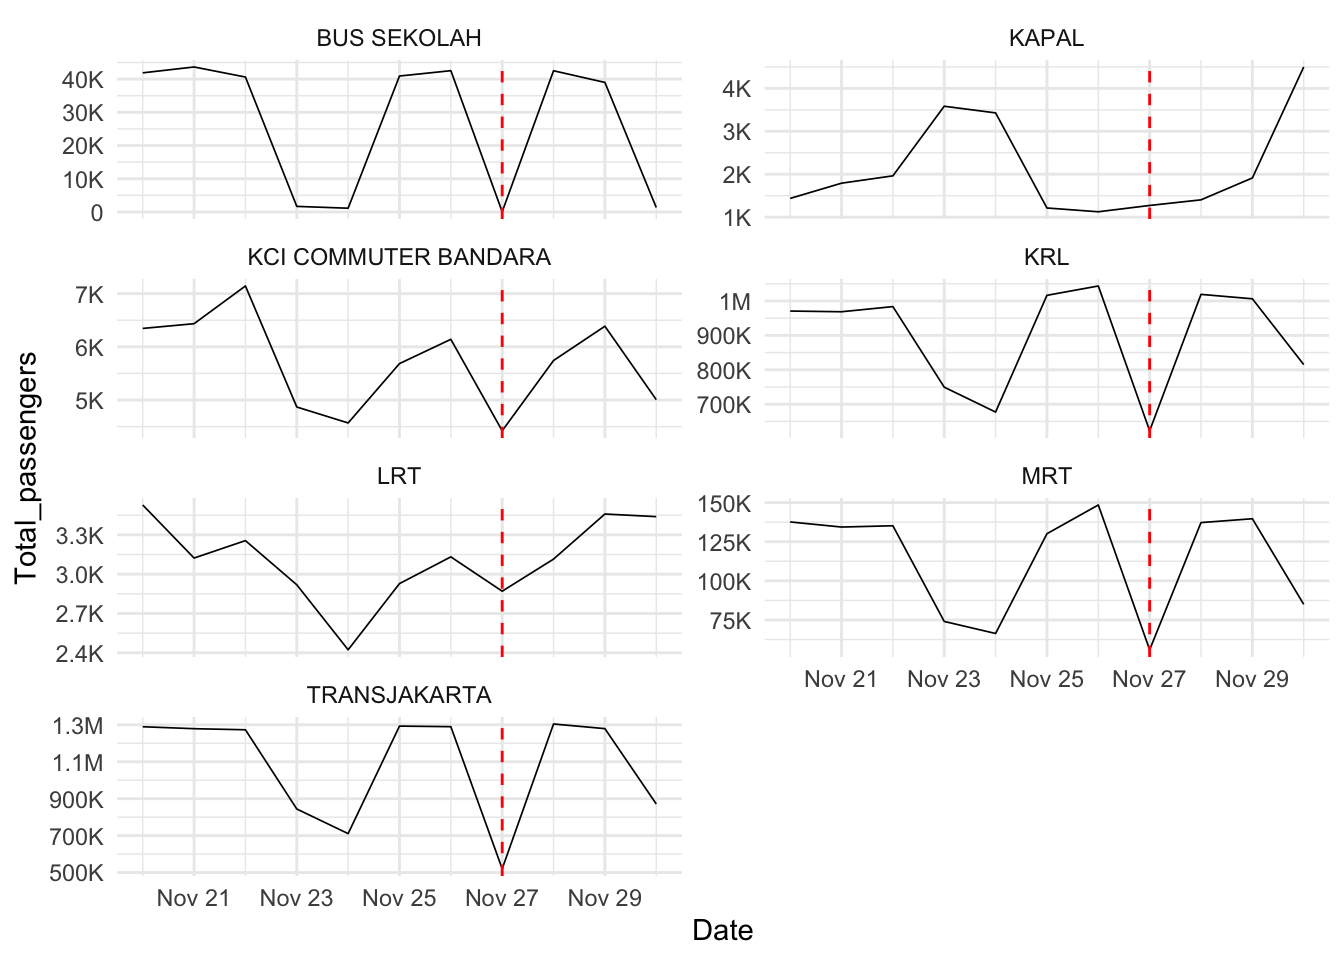
On 27 November 2024, there is a nationwide election and it was declared as a national holiday. A consequence of this, is that some mode of transport delayed their starting operational hours. On top of that, the day being declared as holiday also decrease total passengers for that day.
We found an unknown dip for TRANSJAKARTA in 11 November 2024. Compared to other mode of transport, the dip in TRANSJAKARTA looks very unnatural. Unfortunately, We could not find anything that causes this. However, there is a route change according to this instagram post. This should not affect the total passengers by that much but maybe it causes some systemic error.
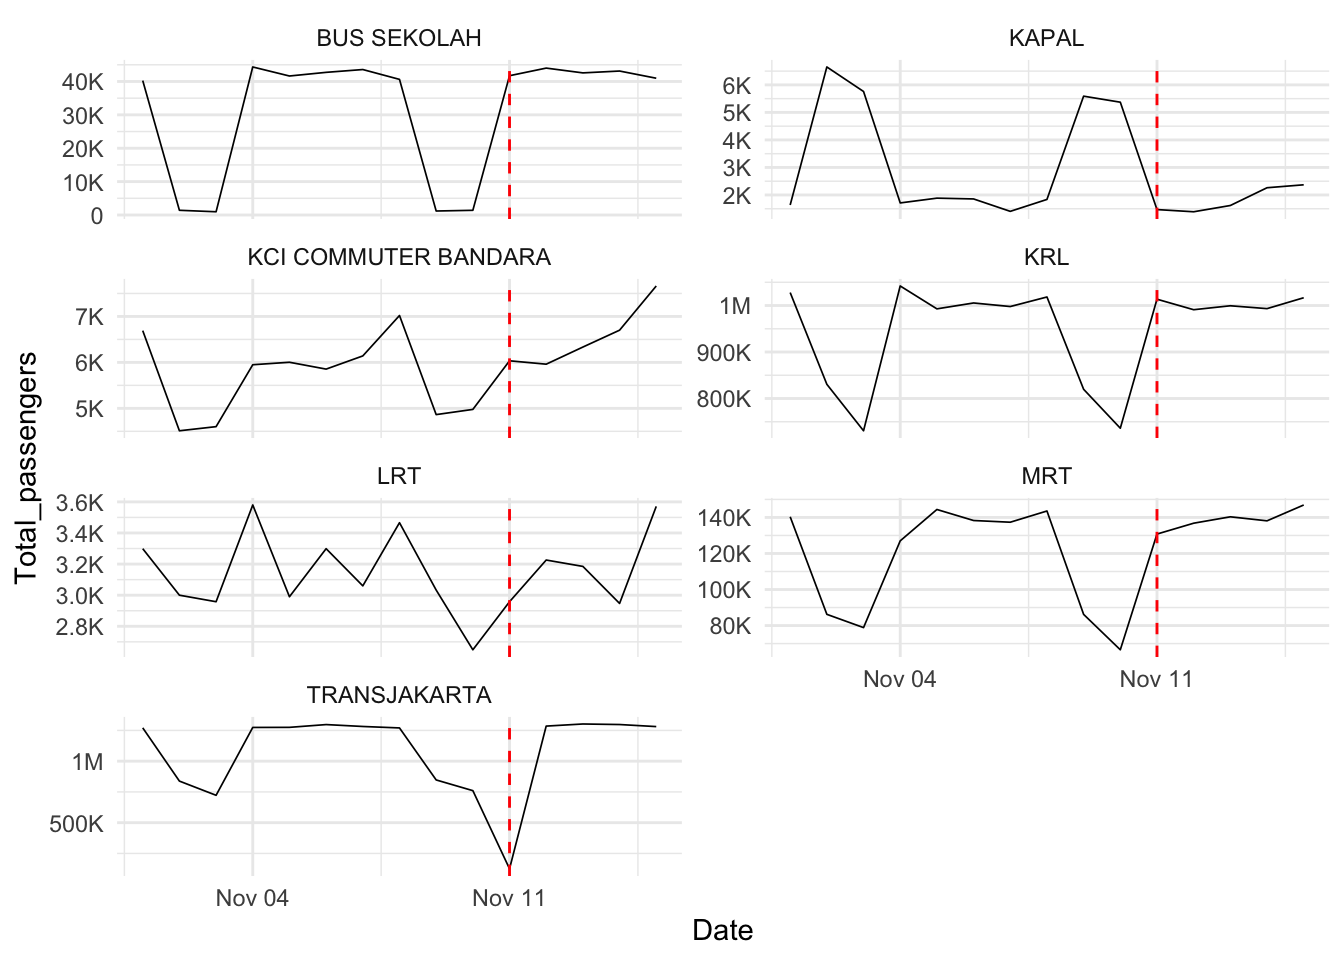
TRANSJAKARTA at 11 November 2024 for unknown reason.
All in all, the only reliably reoccurring event that shows some kind of effect on total passengers is Eid. Hence, We will specify the date range for future Eid dates, and add this as a variable to one of our model.
Modelling Result
We will be mainly using three types of model that varies in their complexity. This allow us to decide which models are best while considering their metrics and their cost.
The first model, which is the simplest is Seasonal Naive (SNaive). This model basically forecasts their future values using the same values from the previous season. In a simpler term, the forecast for next Tuesday, is the total passengers from last Tuesday. This model should serve as our baseline, where if other model perform worse than this, then that model is not even worth considering.
The next model is Exponential Smoothing. This method decomposes the total passengers data into three components, which is Error, Trend, and Seasonality (ETS). The forecast is derived from these three components.
Lastly, the most complicated model that we will use is Seasonal Autoregressive Integrated Moving Average (SARIMA). There is no simple way to explain this model, but this model used the recent values, recent errors, and the seasonality. We also added Eid variable so the model knows of this event in advance.
To evaluate these models, we will be using two metrics. The first one is Mean Absolute Scaled Errors (MASE). It is basically a mean absolute error scaled by the naive prediction error. To read this metric, one would consider that if the metric is less than 1, then it performs better than naive prediction, if it equals to one, then it performs the same as naive prediction, if it is more than 1, then it is worse than naive prediction.
Then, to make sure we take surges and dips into consideration, we will be using Root Mean Squared Scaled Errors (RMSSE). We can read it the same way as MASE, but, this metric puts more weight towards predictions that are way off.
For a more detailed modelling processes, explanations, and justifications, do check the technical file.
| Model |
KRL
|
TRANSJAKARTA
|
MRT
|
|||
|---|---|---|---|---|---|---|
| MASE | RMSSE | MASE | RMSSE | MASE | RMSSE | |
| ETS | 0.802 | 0.747 | 0.817 | 0.748 | 0.958 | 0.845 |
| SARIMA | 0.829 | 0.722 | 0.927 | 0.690 | 0.902 | 0.789 |
| SNaive | 1.021 | 1.013 | 0.989 | 0.956 | 1.111 | 1.065 |
Both ETS and SARIMA for all mode of transport, have less than 1 in their scaled metrics. For KRL and TRANSJAKARTA, ETS performs better in terms of MASE while SARIMA performs better in terms of RMSSE. These results suggest that SARIMA handled sharp spike / dips better than ETS while the ETS performs better in the typical week. This means that the best model for these two mode of transport, are dependent on what we deemed more important in the forecast, is it general prediction? or handling event as a regressor?
For MRT however, SARIMA performed better in both MASE and RMSSE, making it the best model overall.
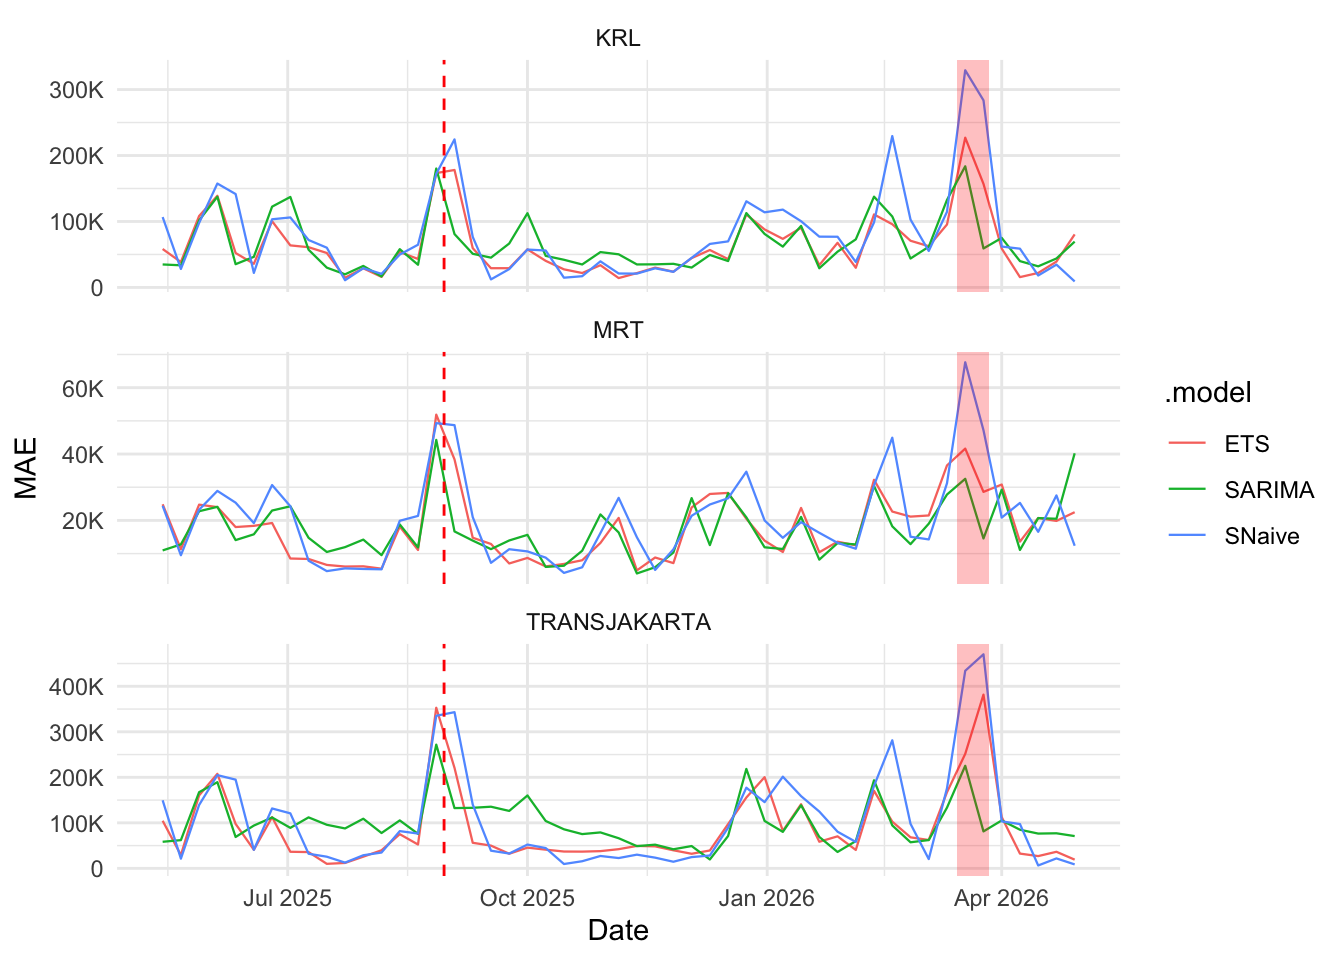
Figure 14 shows the Mean Absolute Error (MAE) where we can see that in general, the ETS have lower MAE, but during the Eid event (marked by red rectangle), the SARIMA performs much better. This is because we defined and included Eid in SARIMA model. Meanwhile, during the unexpected event, which is the riot in August 2025, we can see that the SARIMA performs about the same as all other models.
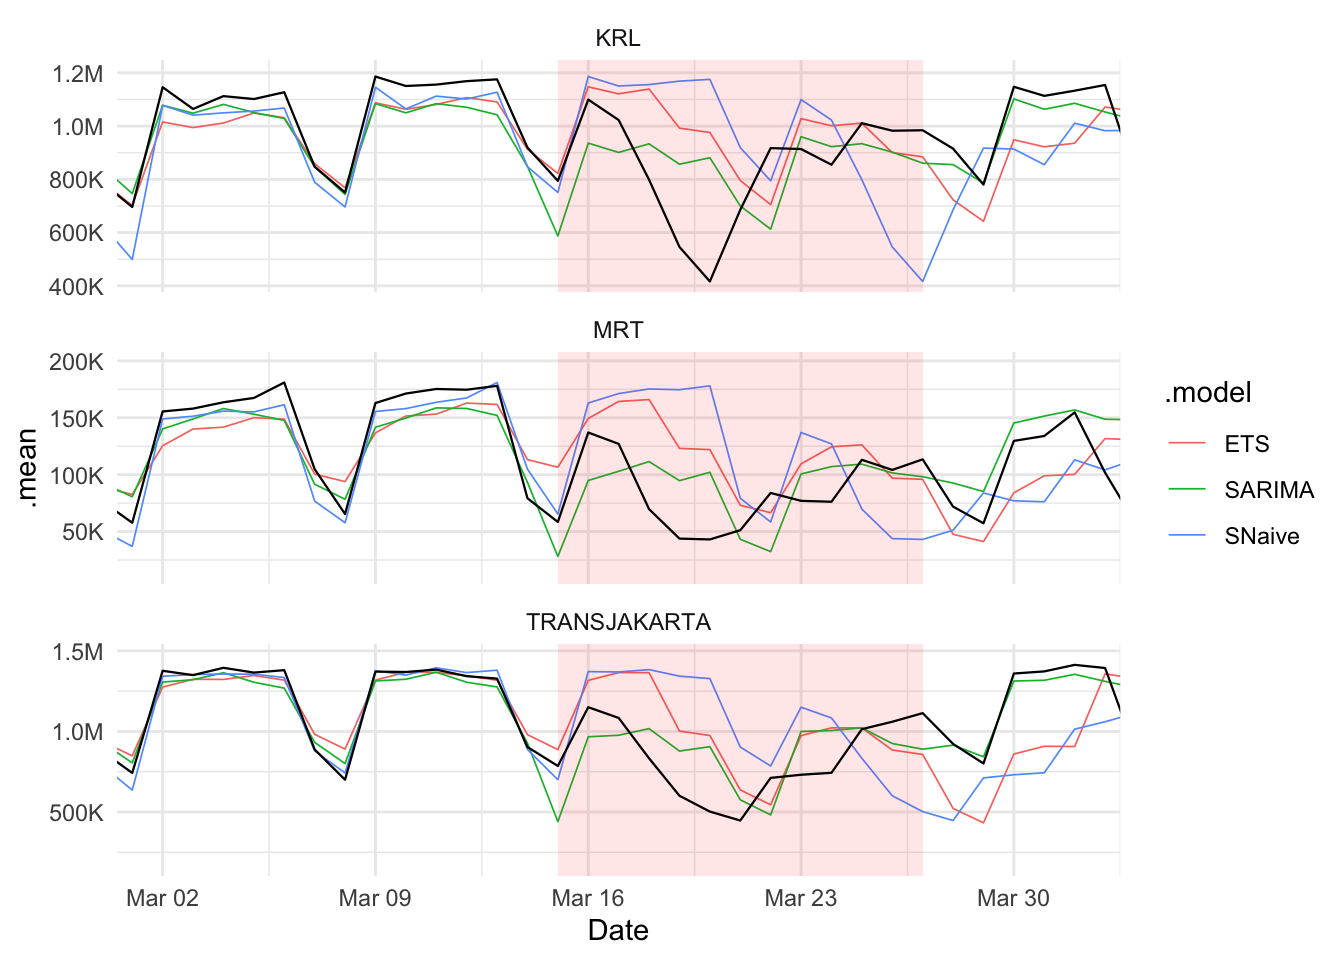
A clear illustration of how the Eid variable in SARIMA affects forecast can be seen in Figure 15. We can see that the red rectangle is where we defined Eid, and the green line dips along the true data while the other models lagged and only dipped a couple days after. This is the reason why SARIMA won the RMSSE for all modes of transport.
Conclusion
We can conclude that for KRL and TRANSJAKARTA, there are two possible best models depending on the purpose of the forecast. The ETS model achieves the best MASE (0.802 and 0.817), while the SARIMA model has the best RMSSE (0.722 and 0.690). The ETS model performs the best when forecasting the typical week, while the SARIMA model handles known events better due to the Eid regressor term. For MRT however, the SARIMA model wins in both MASE (0.902) and RMSSE (0.789) so there is no trade-off here.
The main thing that differentiates the ETS model and SARIMA model, aside from the model structure, is the regressor term that we added. It allows the SARIMA model to follow the change that happens during the event immediately, instead of adjusting after the event happened like the ETS model did.
However, in this dataset, the training data only has two Eid so the result might not be optimal. Not to mention, there are one-offs that happened, the August 2025 riot, the November 2024 election holiday (should not be one-offs but with this dataset, they are) and data inconsistencies around Nataru that we had to impute against the BPS data so it only approximates the daily total passengers shape. With a cleaner data around Nataru and more data, Nataru might be added as a regressor term for SARIMA which might change the model performance as well.